
Energy Dashboard UI UX Design represents the critical interface between voluminous industrial telemetry and the cognitive response of the infrastructure operator. In the modern technical stack, this layer sits atop the data ingestion and processing tiers; typically interacting with a combination of Time Series Databases (TSDB), Programmable Logic Controllers (PLC), and Message Queuing Telemetry Transport (MQTT) brokers. The primary role of this interface is to mitigate the information density problem, where raw sensor data creates a high cognitive load that can lead to delayed reaction times during critical fault states. By applying rigorous UI UX principles to energy management, architects can transform thousands of discrete data points into a cohesive narrative of system health. This manual addresses the “Problem-Solution” context where high latency in operator perception results in inefficient energy consumption or hardware failure. We define a robust dashboard as one that reduces the “Time-to-Insight” from minutes to seconds; ensuring that thermal-inertia and load imbalances are addressed before they breach safety thresholds.
TECHNICAL SPECIFICATIONS
| Requirement | Default Port / Operating Range | Protocol / Standard | Impact Level (1-10) | Recommended Resources |
| :— | :— | :— | :— | :— |
| Data Ingestion | Port 8086 (InfluxDB) / 1883 (MQTT) | MQTT v5.0 / IEEE 2030.5 | 9 | 4 vCPU / 8GB RAM |
| UI Refresh Rate | 500ms – 5000ms Polling | WebSockets / gRPC | 7 | High-bandwidth NIC |
| Signal Accuracy | +/- 0.5% Threshold | IEC 61850 | 10 | Shielded Cat6a / Fiber |
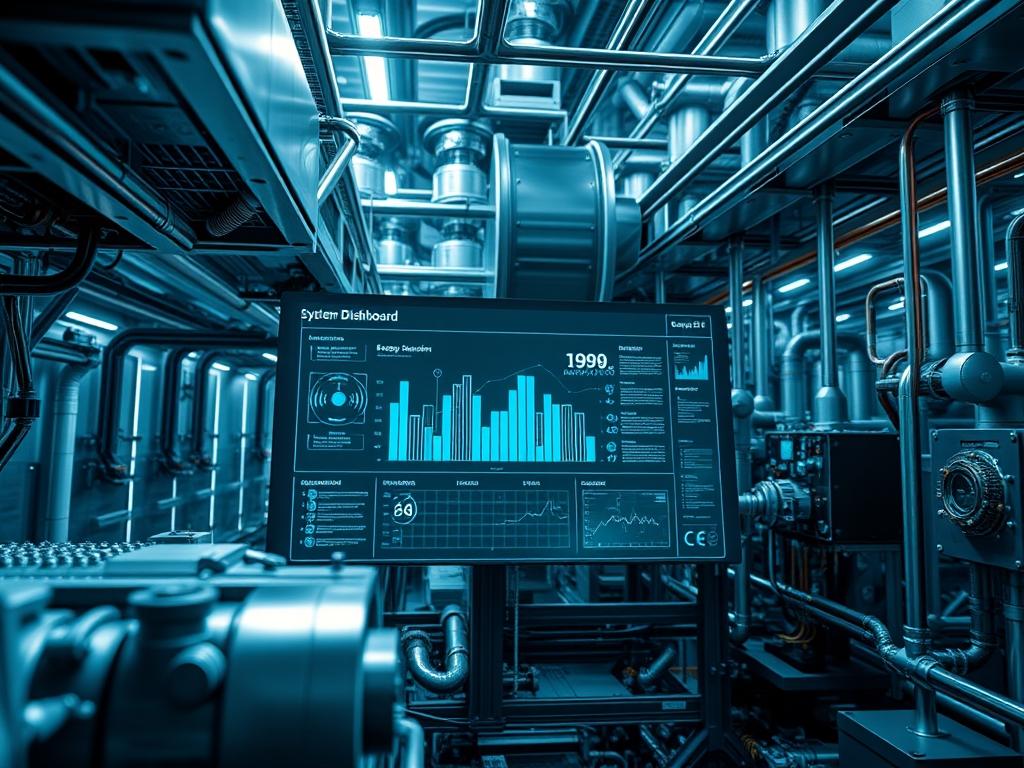
| Visualization Layer | 1080p – 4K Resolution | HTML5 / Canvas / SVG | 6 | Dedicated GPU (Integrated) |
| Latency Tolerance | < 200ms End-to-End | TCP/IP Stack | 8 | Low-latency Kernel |
THE CONFIGURATION PROTOCOL
Environment Prerequisites:
Successful deployment of an Energy Dashboard UI UX Design framework requires a Linux-based environment, preferably Ubuntu 22.04 LTS or RHEL 9. The underlying kernel must be optimized for high-volume I/O operations. Ensure that Node.js v18+ and Docker Engine v24+ are installed. From a regulatory standpoint, all UI elements must comply with ISO 9241-11 for ergonomics and ISO 50001 for energy management systems. Administrative access via sudo is required for modifying system-level networking configurations and persistent storage paths.
Section A: Implementation Logic:
The architecture of a high-performance energy dashboard relies on the principle of encapsulation; where complex underlying logic is shielded from the user while remaining accessible via drill-down mechanics. The design must be idempotent; meaning a specific set of inputs from the field sensors must consistently result in the same visual state across different operator stations. We prioritize the “Overview First, Zoom and Filter, Then Details-on-Demand” mantra. Technically, this involves a layered data strategy: the UI does not query the raw database directly. Instead, it interacts with a filtered cache or a materialized view to reduce the payload size and minimize latency. By reducing the overhead of the visualization engine, we ensure that the throughput of the operator’s decision-making process is not throttled by the software’s rendering speed.
Step-By-Step Execution
1. Initialize the Ingestion Service
Execute the command systemctl start telegraf after configuring the telegraf.conf file located at /etc/telegraf/. This service will act as the primary collector for Modbus or SNMP data.
System Note: This action initiates the data collection daemon that maps physical registers from the PLC to virtual tags. It establishes the initial concurrency limits for inbound telemetry packets.
2. Configure the Time-Series Repository
Access the database CLI using influx v1 shell and create a new bucket named energy_telemetry with a retention policy of 30 days. Define the shard duration to optimize for large payload writes.
System Note: This command configures the storage engine to handle high-frequency writes. It ensures that data aging does not introduce excessive disk I/O overhead during the compaction process.
3. Deploy the Visualization Middleware
Deploy the dashboard container using docker-run -d -p 3000:3000 –name energy-dashboard grafana/grafana-enterprise. Ensure the GF_SECURITY_ADMIN_PASSWORD variable is set to a hardened string.
System Note: This step spins up the UI engine. It creates a virtualized networking bridge that handles the encapsulation of HTTP/2 traffic between the browser and the backend data source.
4. Calibrate UI Thresholds and Alarms
Open the dashboard settings and navigate to the Alerting tab. Define a rule for thermal-inertia monitoring on the main transformer: if temp_c > 85 for more than 5 minutes, trigger a P1 notification.
System Note: This configures the logic-controller within the UI to monitor for specific state changes. It operates independently of the visualization layer to ensure that critical signal-attenuation or sensor failure is reported even if the dashboard is not being actively viewed.
5. Validate Physical Sensor Integrity
Use a fluke-multimeter or a similar calibrated hardware tool to verify that the digital readout on the UI matches the physical voltage at the busbar. Adjust the calibration_offset in the configuration file if a discrepancy exists.
System Note: This step aligns the software representation with the physical asset. It accounts for potential packet-loss or transmission errors that might lead to deceptive UI states.
Section B: Dependency Fault-Lines:
The most common failure in an energy dashboard deployment is a mismatch between the sensor sampling rate and the UI refresh interval. If the UI attempts to poll a database every 100ms while the database only updates every 1000ms, the system incurs unnecessary CPU overhead and potentially creates “Ghost Spikes” due to race conditions. Another significant bottleneck is network latency in distributed sites; if the signal-attenuation on a wireless sensor node is too high, the dashboard may display “Stale Data” without alerting the operator. Always ensure that the UI possesses a “Heartbeat” indicator for every connected hardware asset to distinguish between a zero-value reading and a lost connection.
THE TROUBLESHOOTING MATRIX
Section C: Logs & Debugging:
When the UI fails to render or displays “N/A” for critical metrics, the first point of audit is the service log. Use the command journalctl -u grafana-server -n 100 to check for database connection timeouts. If the error code 503 Service Unavailable appears, the issue likely resides in the proxy or the database itself being overwhelmed by concurrency demands.
For hardware-level debugging, check the logs at /var/log/telegraf/telegraf.log. Look for “Modbus Timeout” or “Packet CRC Error.” These errors suggest physical layer issues such as electromagnetic interference or a faulty gateway. If the UI exhibits significant “Lag,” check the browser’s developer console (F12) for “Long Tasks” or excessive payload sizes in the network tab. Often, reducing the number of data points via a “1-minute Average” function in the query logic will resolve these rendering bottlenecks. Use chmod 644 on configuration files to ensure the service can read the necessary credentials without compromising security.
OPTIMIZATION & HARDENING
Performance Tuning:
To maximize throughput, implement data downsampling. Instead of plotting every raw data point, use a “Max/Min/Average” aggregation strategy for historical views. This reduces the overhead on the client’s GPU. For the real-time layer, use WebSockets to push data to the browser rather than having the browser poll the server. This reduces header latency and minimizes the impact of high concurrency when multiple operators are viewing the same data set.
Security Hardening:
Secure the dashboard by enforcing TLS 1.3 for all traffic. Use the command openssl req -x509 -nodes -days 365 to generate certificates for the localized server. Implement Role-Based Access Control (RBAC) to ensure that only “Level 2” operators can change setpoints or alarm thresholds. Map the dashboard service to a non-standard port and use ufw allow 443/tcp while blocking the default administrative ports to the public interface.
Scaling Logic:
As the infrastructure grows from a single facility to a global network, the UI architecture must transition to a “Federated” model. Use a central visualization hub that queries local data collectors rather than centralizing all raw telemetry. This minimizes the risk of wide-area network packet-loss affecting the entire system and keeps the latency of the local operator’s view as low as possible.
THE ADMIN DESK
Q1: How do I handle dashboard flickering during high refresh rates?
Ensure your browser has hardware acceleration enabled and increase the render_timeout in the configuration. Flickering is usually caused by the UI engine clearing the canvas before the next payload has been fully processed by the local CPU.
Q2: Why is there a delay between the physical switch and the UI update?
Check the polling interval in telegraf.conf. If the interval is set to 10s, the UI cannot show the change faster than that. Lower the interval to 1s, but monitor the increase in system overhead.
Q3: Can I run this UI on a low-power tablet?
Yes, but you must minimize the number of SVG elements. Use Canvas-based rendering for high-density charts to reduce the memory footprint. Lower the dashboard’s concurrency settings to prevent the tablet’s browser from crashing.
Q4: What does a “Stale Data” alert mean?
This indicates that the timestamp in the energy_telemetry bucket has not updated within the expected window. It usually points to a network failure or a crashed ingestion service rather than a sensor fault.
Q5: How do I backup the entire UI configuration?
Export the dashboard JSON files and backup the grafana.db file located in /var/lib/grafana/. This ensures an idempotent recovery process if the primary server experiences a catastrophic hardware failure.