
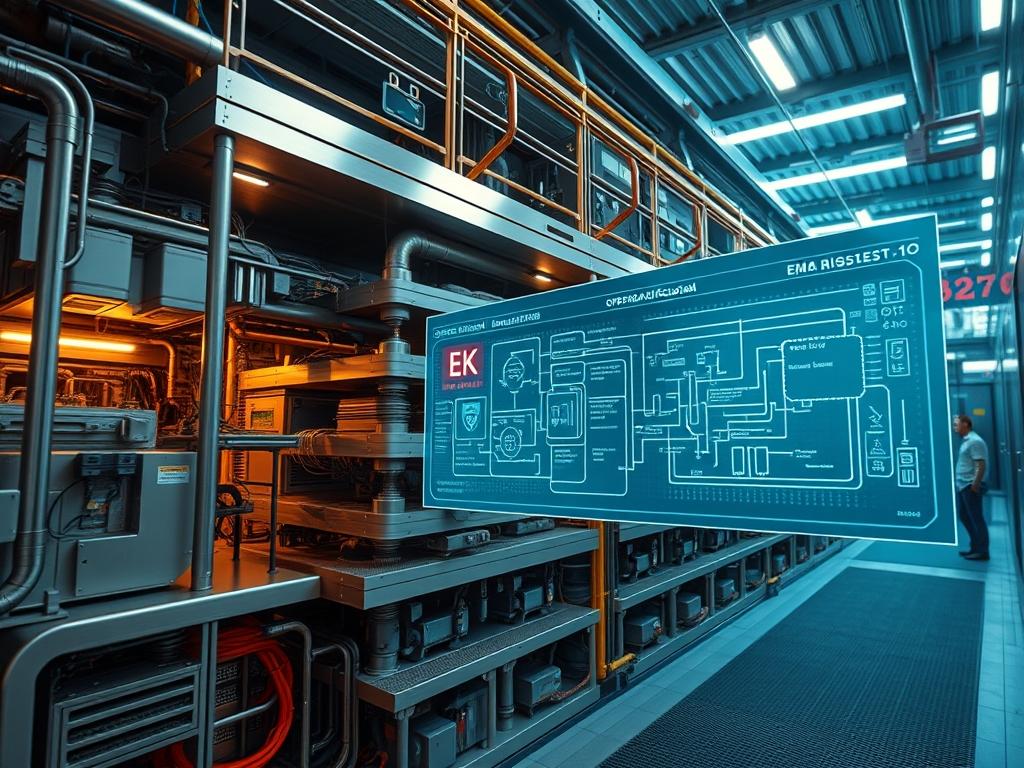
EMS Multi Tenant Architecture serves as the foundational framework for modern energy management systems transitioning to a Software-as-a-Service (SaaS) model. In the context of large-scale utility grids, commercial microgrids, and industrial IoT (IIoT) networks,this architecture enables a single application instance to serve multiple distinct customers, known as tenants, while maintaining strict data isolation and performance parity. The primary engineering challenge addressed by EMS Multi Tenant Architecture is the “Noisy Neighbor” effect: where high-frequency telemetry ingestion from one tenant degrades the system performance for others. By implementing a robust multi-layered isolation strategy at the database, application, and network tiers, engineers can provide secure, scalable, and granular energy monitoring. This architecture mitigates the high overhead of maintaining separate hardware for every user, replacing physical fragmentation with logical encapsulation. The solution combines high-throughput data pipelines with strict Row Level Security (RLS) to ensure that energy consumption patterns, sensitive grid configurations, and billing data remain confidential and inaccessible across tenant boundaries.
TECHNICAL SPECIFICATIONS
| Requirement | Default Port/Range | Protocol/Standard | Impact Level (1-10) | Recommended Resources |
| :— | :— | :— | :— | :— |
| Telemetry Ingestion | 502 (Modbus) | Modbus/TCP | 9 | 4 vCPU / 8GB RAM |
| Message Broker | 1883 / 8883 | MQTT / MQTTS | 8 | 2 vCPU / 4GB RAM |
| Database Tier | 5432 | PostgreSQL/RLS | 10 | 8 vCPU / 16GB RAM |
| Caching Layer | 6379 | Redis Cluster | 7 | 4GB RAM (High Speed) |
| API Gateway | 443 | HTTPS/TLS 1.3 | 9 | 2 vCPU / 4GB RAM |
| Grid Interface | 2030.5 | IEEE 2030.5 | 8 | 1 vCPU per 50 nodes |
THE CONFIGURATION PROTOCOL
Environment Prerequisites:
Successful deployment of an EMS Multi Tenant Architecture requires a strict adherence to distributed computing standards. Hardware components, specifically Smart Meters and Power Quality Analyzers, must support Modbus/TCP or DNP3 protocols. On the software side, the environment must utilize Kubernetes v1.26+ for container orchestration to manage resource quotas effectively. Database systems must be capable of executing idempotent migrations to prevent data corruption during scaling events. Furthermore, the administrative user must possess root or sudo privileges on the host systems and ClusterAdmin roles within the K8s environment. Compliance with IEEE 2030.5 is mandatory for any architecture interfacing with public utility assets to ensure interoperability and cybersecurity standards are met.
Section A: Implementation Logic:
The theoretical foundation of this architecture rests on the principle of logical multi-tenancy. Unlike physical multi-tenancy, where separate servers are provisioned for each client, logical multi-tenancy uses a shared schema or shared database approach. We utilize Row Level Security (RLS) in PostgreSQL to inject a tenant_id filter into every query at the kernel level. This ensures that even a leaked SQL query cannot access data belonging to another tenant. The data pipeline is designed for high concurrency: using an asynchronous message broker like RabbitMQ or Kafka to decouple the ingestion of high-frequency energy metrics from the processing and storage layers. This helps maintain low latency even during peak load periods where thousands of meters may be reporting data simultaneously.
Step-By-Step Execution
Step 1: Provisioning Network Namespace Isolation
Execute the command ip netns add tenant_proto_1 to create an isolated network stack for the primary data ingestion service. Bind the specific NIC to this namespace to prevent cross-tenant packet sniffing at the hardware level.
System Note: This action utilizes the Linux kernel namespaces to isolate the network stack. By segregating the TCP/IP stack, we reduce the risk of lateral movement should one tenant-facing service be compromised. It ensures that packet-loss or broadcast storms in one segment do not impact the global system throughput.
Step 2: Policy Configuration for PostgreSQL RLS
Access the database via psql and execute ALTER TABLE telemetry_data ENABLE ROW LEVEL SECURITY;. Follow this with the creation of a policy: CREATE POLICY tenant_isolation_policy ON telemetry_data USING (tenant_id = current_setting(‘app.current_tenant’));.
System Note: This command modifies the access control list (ACL) of the database engine. By enabling RLS, the database itself becomes the final arbiter of data privacy. It forces the database engine to check the tenant_id against the session variable of the requesting service before returning any payload, effectively neutralizing most SQL injection vulnerabilities.
Step 3: Configuring the MQTT Broker with Port 8883
Edit the mosquitto.conf file to enable TLS 1.3 on port 8883. Use chmod 600 on the private key files to ensure they are only readable by the service account. Restart the service using systemctl restart mosquitto.
System Note: Secure MQTT is vital for EMS architectures to prevent man-in-the-middle attacks on sensitive energy data. This configuration ensures that the signal-attenuation observed in physical wireless links does not lead to compromised data integrity. It enforces encapsulation of the telemetry data within an encrypted tunnel.
Step 4: Deploying Local Telemetry Collectors
On the physical gateway device, deploy the collector agent and verify connectivity to the Modbus meter using tcpdump -i eth0 port 502. Verify the register mapping by polling the Input Registers via the modpoll tool.
System Note: This step verifies the physical to digital bridge. Monitoring port 502 allows the architect to observe the raw hex data frames. This is critical for identifying signal-attenuation or wiring faults that manifest as parity errors or CRC failures in the Modbus stream.
Step 5: Implementing Resource Quotas in Kubernetes
Apply a ResourceQuota manifest using kubectl apply -f quota.yaml. Define strict limits on cpu and memory for each tenant namespace to prevent a single tenant from consuming all available cluster resources.
System Note: This enforces administrative control over concurrency and CPU cycles. By capping the resources available to each tenant-specific microservice, the system architect prevents a memory-leak or a runaway process in one tenant’s environment from crashing the entire host node.
Section B: Dependency Fault-Lines:
The primary failure points in an EMS Multi Tenant Architecture often occur at the junction of the physical and virtual layers. Signal-attenuation in long-run RS-485 cables can lead to fragmented Modbus packets, which the cloud-side ingestion service may reject as malformed. Another critical bottleneck is database concurrency; if the index for tenant_id is not properly optimized, query latency will grow exponentially as the number of rows in the telemetry_data table increases. Furthermore, library conflicts between libmodbus and newer Python environments can cause the collector agents to crash unexpectedly during service reloads. Always ensure that the glibc version on the gateway hardware matches the requirements of the compiled binaries to avoid segmentation faults.
THE TROUBLESHOOTING MATRIX
Section C: Logs & Debugging:
When a tenant reports a loss of data visibility, immediately inspect the collector logs located at /var/log/ems/collector.log. Look for error strings such as Connection timed out or Resource temporarily unavailable. If the error code ETIMEDOUT is present, check the physical connectivity and firewall rules on port 502. For cloud-side issues, examine the API gateway logs via journalctl -u nginx. If you observe a high frequency of 504 Gateway Timeout errors, it typically indicates that the downstream processing service is overwhelmed, pointing to a throughput bottleneck or a massive increase in telemetry payload size. Use a fluke-multimeter to check the voltage on the RS-485 lines if packet-loss exceeds 5 percent: physical layer noise often translates to perceived software instability.
OPTIMIZATION & HARDENING
– Performance Tuning: To optimize for high throughput, implement a caching strategy using Redis. Store the “Last Known Value” (LKV) of every energy meter in a Redis Hash. This reduces the overhead on the primary PostgreSQL instance by allowing the API to serve real-time dashboard data directly from memory.
– Security Hardening: Implement a “Deny-All” ingress policy using iptables or a Kubernetes NetworkPolicy. Only allow traffic from the known IP addresses of the physical gateways. Use chroot jails for any legacy data-parsing scripts to ensure that a breach in the script execution environment cannot access the host kernel.
– Scaling Logic: Utilize a horizontal pod autoscaler (HPA) governed by custom metrics like “Active Modbus Connections” rather than just CPU usage. As the number of tenants grows, the architecture should shard the database across multiple physical volumes based on the tenant_id to maintain consistent IOPS and minimize thermal-inertia in the storage arrays by distributing the write load.
THE ADMIN DESK
How do I offboard a tenant without downtime?
Run an idempotent script to revoke the database tenant_id role. Then, trigger a kubectl delete namespace command. The RLS policies will instantly block all data access while the background cleanup process removes the biological data signatures from the shared disks.
Why is my telemetry latency increasing?
Check for packet-loss at the site gateway and verify the throughput of the message broker. High latency is often caused by unindexed queries in the PostgreSQL layer or the ingestion service reaching its concurrency limit during peak load.
Can I mix Modbus and MQTT tenants?
Yes. The architecture uses a protocol-agnostic ingestion layer. Every incoming payload is normalized into a standard JSON format at the edge, ensuring that the core EMS logic remains decoupled from the specific transport protocol used by the hardware.
What happens if the Redis cache fails?
The system logic includes a fall-through mechanism. If the Redis cluster is unreachable, the API will query the PostgreSQL database directly. While this increases latency, it ensures the system remains operational until the caching layer is restored and re-synchronized.